
Tyto Robotics investigates the differences between CFD modeling and experimental testing, particularly focusing on a 60” UAV propeller, with insights from a recent evaluation. Discover more >>

This report encapsulates the findings from tests and simulations aimed at understanding the correlation between numerical simulations and experimental results for a 60″ UAV propeller.
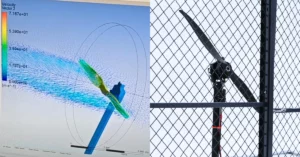
Utilizing Ansys Fluent software, a CFD model was created for the 60” propeller, wich was subsequently tested using the
Flight Stand 150
thrust stand.
The findings revealed that during tests conducted at 1000 – 2000 RPM, the CFD simulation underestimated thrust by a staggering 69%.
Overview
A common inquiry posed to the company is: “If we are planning to conduct CFD simulations, is it still necessary to perform experimental tests on our motors and propellers?”
While Tyto Robotics admits a potential bias, their response is consistently affirmative, and for valid reasons. The company engages in numerous CFD simulations,yet they recognize that these simulations do not provide definitive answers regarding propulsion systems; rather,they offer insights into potential performance outcomes.
Simulations are particularly beneficial for predicting the impact of specific variable adjustments within a well-defined system.
The extent of the discrepancy between simulation and actual performance varies based on several factors, including the selection of turbulence models, mesh configurations, boundary conditions, and discretization techniques employed.
In this analysis, Tyto Robotics quantifies the gap between simulated and actual performance for a 60” UAV propeller, as detailed below.

Methodology
The simulations and experimental tests were conducted concurrently over several weeks.
The Ansys simulation was crafted to replicate the experimental lab environment, accounting for wall proximity, obstacles, and the overall dimensions of the space. The thrust stand and propulsion system were modeled to match the exact specifications of their real-world counterparts.
Each Ansys simulation required an average of 10 days to finalize on a computer equipped with a state-of-the-art GPU. Occasionally, simulations woudl fail to converge, necessitating parameter adjustments before restarting. In total, the twelve simulations took approximately 20 weeks to complete. Prior to these simulations, the Tyto Robotics team underwent 16 hours of training with a consultant.
Concurrently, Tyto conducted experimental tests utilizing the
Flight Stand 150 thrust stand
. A 60kW power supply was employed to operate the stand, which was equipped with a TA150 motor and a 60” propeller.
Specifications
Experimental Test:
Thrust Stand: flight Stand 150 (150 kgf / 150 nm)
Motor: TA150
Propeller: 60” diameter
ESC: Pulse P40
Power Source: 60 kW power supply from MCB Electronics
Software: Flight Stand software
Test Area:
Distance from Flight Stand to back wall – 3 m
Distance from rotating domain to top wall – 3 m
Distance from rotating domain to side walls – 2.74 m
CFD Model:
Software
Ansys Fluent – version R1 (21.1)
Geometry of Static Domain
X – 7.06 m (width)
Y – 5.1 m (height)
Z – 15.3 m (length – wall downstream of propeller to wall upstream of propeller)
Mesh
-
Unstructured polyhedral mesh elements
-
Total number of elements – 3,181,422
-
6 Inflation layers on propeller boundary – first layer 1.5 mm with growth rate of 1.2 (boundary layer not resolved)
Discretization Scheme
-
All terms – 2nd order upwind discretization
Turbulence Model
-
K-omega SST (steady-state)

Findings
A Python script was created to establish a correlation between the experimental and CFD data through least squares polynomial regression.This correlation was derived using only the experimental data points available up to 1900 RPM.The aim of this regression was to formulate a function as follows:

The following steps were taken to achieve this:
-
Store experimental and CFD data in distinct arrays along with their corresponding RPM values.
-
Fit a second-order polynomial to both the experimental and CFD data series.
-
Utilize the equations of the fitted polynomials to generate evenly spaced data points for both data series.
-
Store the evenly spaced CFD data points in a new ‘X array’ and the evenly spaced experimental data in a new ‘Y array’.
-
Employ these new arrays to fit a polynomial function between the ‘X array’ and ‘Y array’ using the Python function np.polyfit().
The resulting equations and plots for the relevant data range are displayed below:
- Figure 4: Least squares curve fit of experimental thrust data
- figure 5: Least squares curve fit of CFD thrust data
- Figure 6: Least squares regression of experimental and CFD thrust data
As illustrated in Figure 6, a linear correlation exists between the experimental and CFD data, with the experimental thrust value being nearly double that predicted by the CFD model.
Stand Force Calculation from Experimental Data:
This section outlines the method for estimating the pressure forces exerted by a propeller on the Flight Stand structure based on experimental data at a constant RPM. the analysis is conducted for a 60-inch propeller with two blades on the Flight Stand 150, and the results are presented below.
Assumption:
In a theoretical scenario, if a perfectly balanced propeller is attached to the force measurement unit (FMU) and spins freely without a stand structure, the ‘Mx’ and ‘My’ measurements would register as zero. However, when a stand is present, each time a propeller blade passes the structure, a high-pressure zone forms between the blade and the stand, resulting in an Mx moment on the FMU. This moment can be utilized to estimate the maximum force on the stand due to fluid-structure interaction.
In practice, propellers are rarely perfectly balanced, leading to one blade generating more thrust than the other (in the case of a two-blade propeller).This imbalance results in an oscillatory ‘My’ measurement on the FMU,peaking when both propeller blades are positioned 90 degrees from the stand (horizontal orientation).
Without a stand, this moment would manifest as an ‘mx’ measurement when the propeller is vertically aligned and as an ‘My’ measurement when horizontally aligned. The magnitude of this moment due to an imbalanced propeller remains constant throughout a cycle but continuously alters in direction.
When the propeller is vertically aligned with one blade in front of the stand, the resultant moment generated purely from fluid-structure interaction between the propeller and the stand is the sum or difference (depending on the propeller’s imbalance) between the maximum ‘Mx’ and ‘My’ measurements throughout a full cycle. This method is employed to estimate the stand force due to fluid-structure interaction.
The force on the Flight Stand 150 was estimated using this approach with a 60-inch propeller operating at 1932 RPM.
The forces and moments across the three axes were initially calculated using raw load cell voltage values. Following this,‘Mx’ and ‘My’ were plotted against each other.
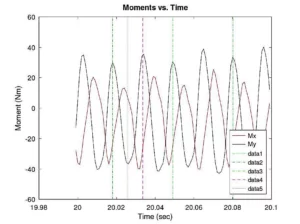
In the figure above, the distance between the two green dot-dash lines ‘-.’ represents one complete revolution of the propeller.
Final thoughts
The findings indicate that the CFD model was able to predict propeller thrust performance with a 69% deviation from the experimentally obtained data.
An optimal strategy for propulsion testing involves utilizing both CFD simulations and experimental assessments to accurately characterize powertrain performance. Once experimental data is gathered, a relationship can be established between the CFD and experimental data, enabling predictions of thrust and torque values for higher RPMs up to a certain threshold.
once this relationship is established, it can be leveraged to forecast system performance with minor modifications, such as employing a propeller with a different pitch or operating the system at elevated RPMs.
while CFD is valuable for making predictions, it is always prudent to validate results through experimental means.
For clients interested in conducting experimental tests on motors and propellers,Tyto Robotics recommends the following thrust stands:
- Series 1585
– measures 5 kgf of thrust / 2 Nm of torque
- Flight Stand 15
– measures 15 kgf of thrust / 8 Nm of torque
- Flight Stand 50
– measures 50 kgf of thrust / 30 Nm of torque
- Flight Stand 150
– measures 150 kgf of thrust / 150 Nm of torque
- Flight Stand 500
– measures 500 kgf of thrust / 1500 Nm of torque
Access the original report here,or explore the tyto Robotics website for more data.


